What is the graph drawing system
GraVis
supposed to do and how is
it being done ? The main intent of this page is to give a review of a
selection of important features
GraVis
offers and thus gives the
user an idea how our system may be helping him to fullfill his needs.
Since
GraVis
is an ongoing project you may want to check out our
future
section to see what we plan to
add in the near future.
Design Goals
As stated in the Welcome !
section, the
design of
GraVis
includes elements making it a generally usable
tool for information visualization, if this data is representable
as graphs. This generality forces
GraVis
to be both
extensible
and
flexible
. To be concrete, the following design elements
realize these goals:
-
Kernel system with no base functionality limitations.
-
Extension modules loadable at runtime.
-
Support for interaction between kernel system and extension modules.
-
Animation of graph modifications by extension modules.
-
Multiple views of a graph.
-
Full set of graphical attributes for graph elements.
-
Highly optimized visualization component.
-
Intuitive graphical user interface.
-
Unlimited undo and redo.
-
Grid mode for orthogonal graph drawing.
-
Special features ensuring support for large graphs.
-
Various input and output formats.
-
Collection of readily usable layout modules.
-
Easy to use program interface to implement extension modules.
-
Higly modularized to ensure maintainability, robustness and extensibility.
However, this is only a collection of the most important features of
GraVis
and contains mostly design elements directly visible to
the user. The functionality described in the list is implemented and
working and if you want to know what is going to be added to the
functionality of
GraVis
, please refer to our
future
section. The remainder of this
page will cover technical details
about how we
have realized the various elements of
GraVis
, except for the
screenshots displayed in the next section.
Screenshots
To show some of the features of
GraVis
a small collection of
screenshots of the currently available version follows. Please click
on the thumbnail image if you want to see the whole screenshot.
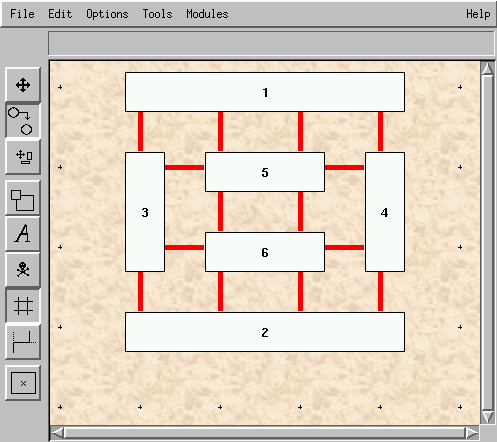
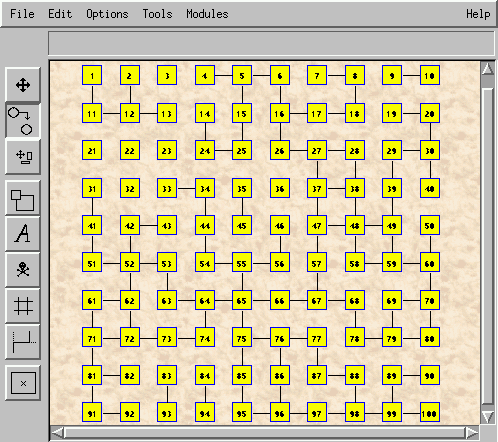
The first row of screenshots displays the support for orthogonal graph layout
in
GraVis
, especially the last image shows the output of one of the
layout modules. The other images give an indication of the interactive
features, like edge offsets and thickness, node sizes, colors and area
highlighting.
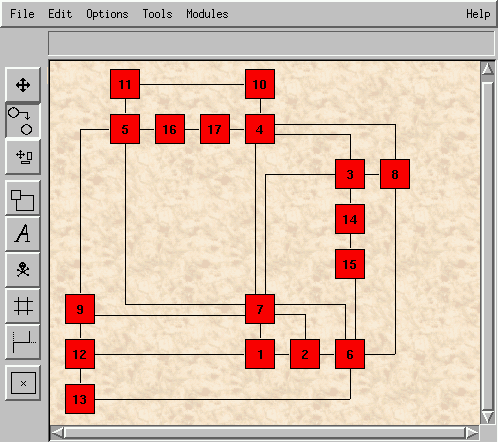
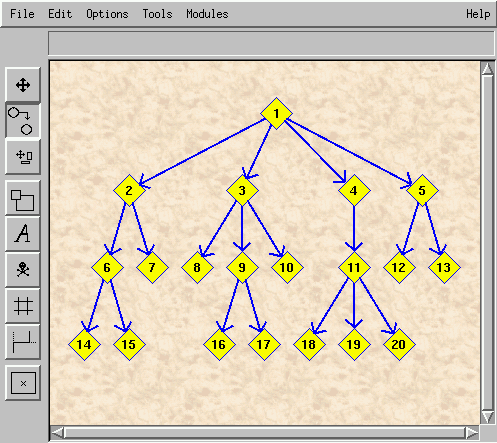
The next row contains images displaying the output of some of the layout
modules currently included in
GraVis
. Again, different graphical
attributes for the graph elements (node type, fill and outline color,
edge direction) are used in each picture. The last graph has been created
with one of the graph generators available as an extension module and also
uses the
zoom
facility.
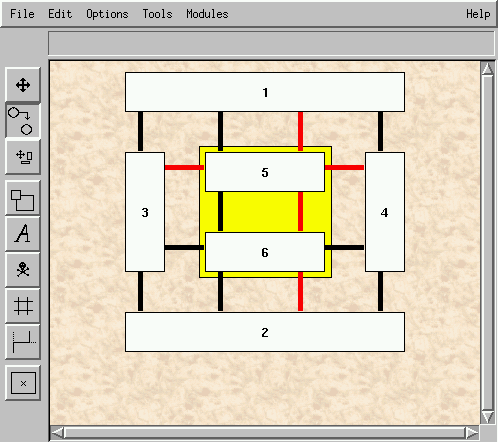
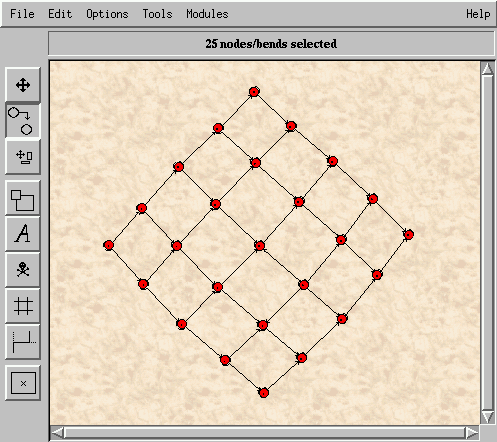
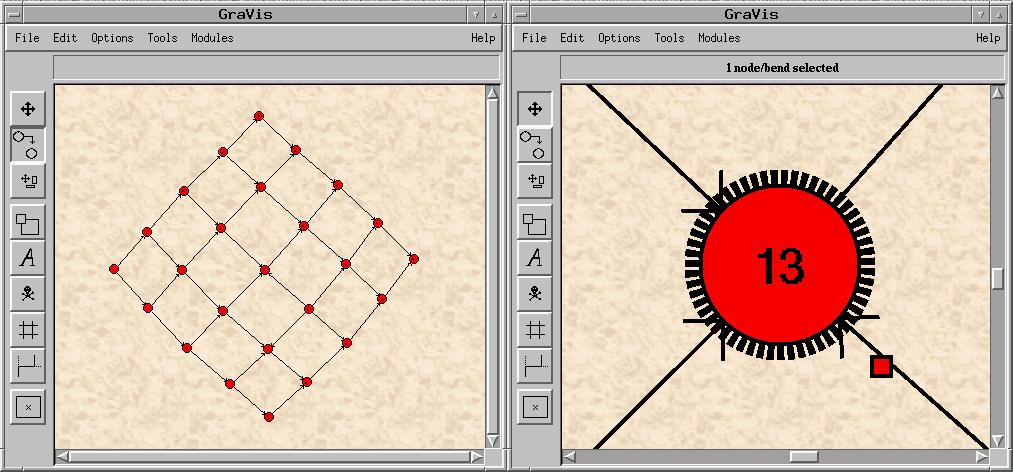
Finally, the last row shows an example of the use of the
observer
concept
. While the first image contains a 5x5 grid at a very low
zoom level, the next image shows two viewers visualizing the same graph.
The right part uses a very high zoom level to display a node in great detail.
Each modifiaction of the graph in any of the (unlimited number of) observers
is automatically forwarded to the other observers.
Technical Information
Some of the important features mentioned at the beginning of this page
are now described and explained more detailed, such that the design goals
and their usefulness become clearer. The following diagram gives an
overview over the general structure of
GraVis

GraVis
is devided into six modules or classes of modules. The top
row represents the kernel system with the exception of the visualization
component (or
Viewer
), which may also be regarded as an external module
since it is not necessary for the kernel to operate. The bottom row represents
the
tools
and
extension modules
with the special characteristic
that they are easily interchangeable, such that eg. some algorithm may be
implemented and tested as a extension module and then compiled into
GraVis
as a tool - or vice versa.
The arrows between the modules represent the communication links used for
command and information exchange. Since each module communicates with the
others by using a communication port, the modules are highly independent
of each other.
Kernel System
The kernel of
GraVis
implements the base functionality of the graph
drawing system and consists of the
Dispatcher
and the
Documents
The role of the dispatcher is to control the startup, execution and shutdown
of
GraVis
by handling and resending command objects.
The design philosophy in
GraVis
follows the object-oriented paradigma
and the system is accordingly implemented in the object-oriented programming
language Eiffel
. To achieve our goal
of maximum flexibility and extensibility, the design uses several techniques
described in greater detail on the language
page of
GraVis
. Important here are the
design patterns
, namely
the
observer
and the
command
pattern. Both are used in the
Dispatcher to implement the communication concept, which is based on sending
command objects between the various modules. The observer pattern controls
the receivers of the command objects.
Multiple graphs are represented by one Document each, which is the other
important component of the kernel system. The base of a document is the
powerfull graph data structure used throughout the system. As indicated
in the structure diagram, graphs are realized as a class hierarchy supporting
two- and three-dimensional coordinates. The Document controls and
handles access to the graphs via the communication interface. The command
objects received by a document are stored on a stack, implementing the
undo/redo mechanism supported by
GraVis
User Interface
One of the highlights of
GraVis
is its intuitive user interface
implemented in the visualization component. The Viewer itself is highly
optimized such that even large graphs can be interactively manipulated
with minimal slowdown. With all these optimizations the Viewer still
supports the complete set of graphical attributes necessary for effective
graph visualization. Among these attributes are:
-
Various node styles.
-
Free selection of fill and line colors from the RGB color scheme.
-
Nodes resizable to arbitrary heights and widths via the
resize knob
-
Edges and outlines have user definable thickness and style.
-
Endpoints of edges may be offset from the node center.
-
Analogously labels may have offsets.
-
Different arrow style and size is supported.
Elimination of extensive input mode changing was the primary design goal
of the user interface. Creating and modifying a graph is very easy and
fast in
GraVis
since almost every important operation can be
performed with the left mouse button. The behaviour changes according to
the context where the button event occured, such that creating nodes, edges
and bends, moving them or creating selections can be done rapidly. The right
mouse button is reserved for delete operations which can affect single graph
elements or whole selections. Finally, the middle mouse button represents
special functions like label editing.
Extension Modules
Extending the functionality of the graph drawing system is an important
aspect of
GraVis
. The extension facility is mainly used to
make new graph algorithm modules available for the system. However, the
facility provides also the important possibility to add communication
interfaces to other applications such that
GraVis
serves as a
visualization frontend. These applications can be very complex like a CASE
tool or very simple like a printing service using a format not directly
supported by
GraVis
Extension modules, which are either standalone or directly compiled into
GraVis
, are independent of the rest of the system and thus form a
module and algorithm library. This library can be used within other
applications provided that the standard interface of the modules is
supported.
When used directly in
GraVis
, extension modules may interact with the
base system in various ways. They can monitor the user input to implement
incremental graph layout algorithms or they can activly update the Viewer
while executing an arbitrary graph algorithm, thus animating it. Using this
interaction scheme, external applications communicating with
GraVis
receive their data and update the Viewer with new data they generate.
Harald Lauer(lauer@informatik.uni-tuebingen.de)